Linux Performance tools
Abstract |
Linux Performance tools |
Authors |
Walter Fan |
Status |
v1 |
Updated |
2024-08-21 |
简介
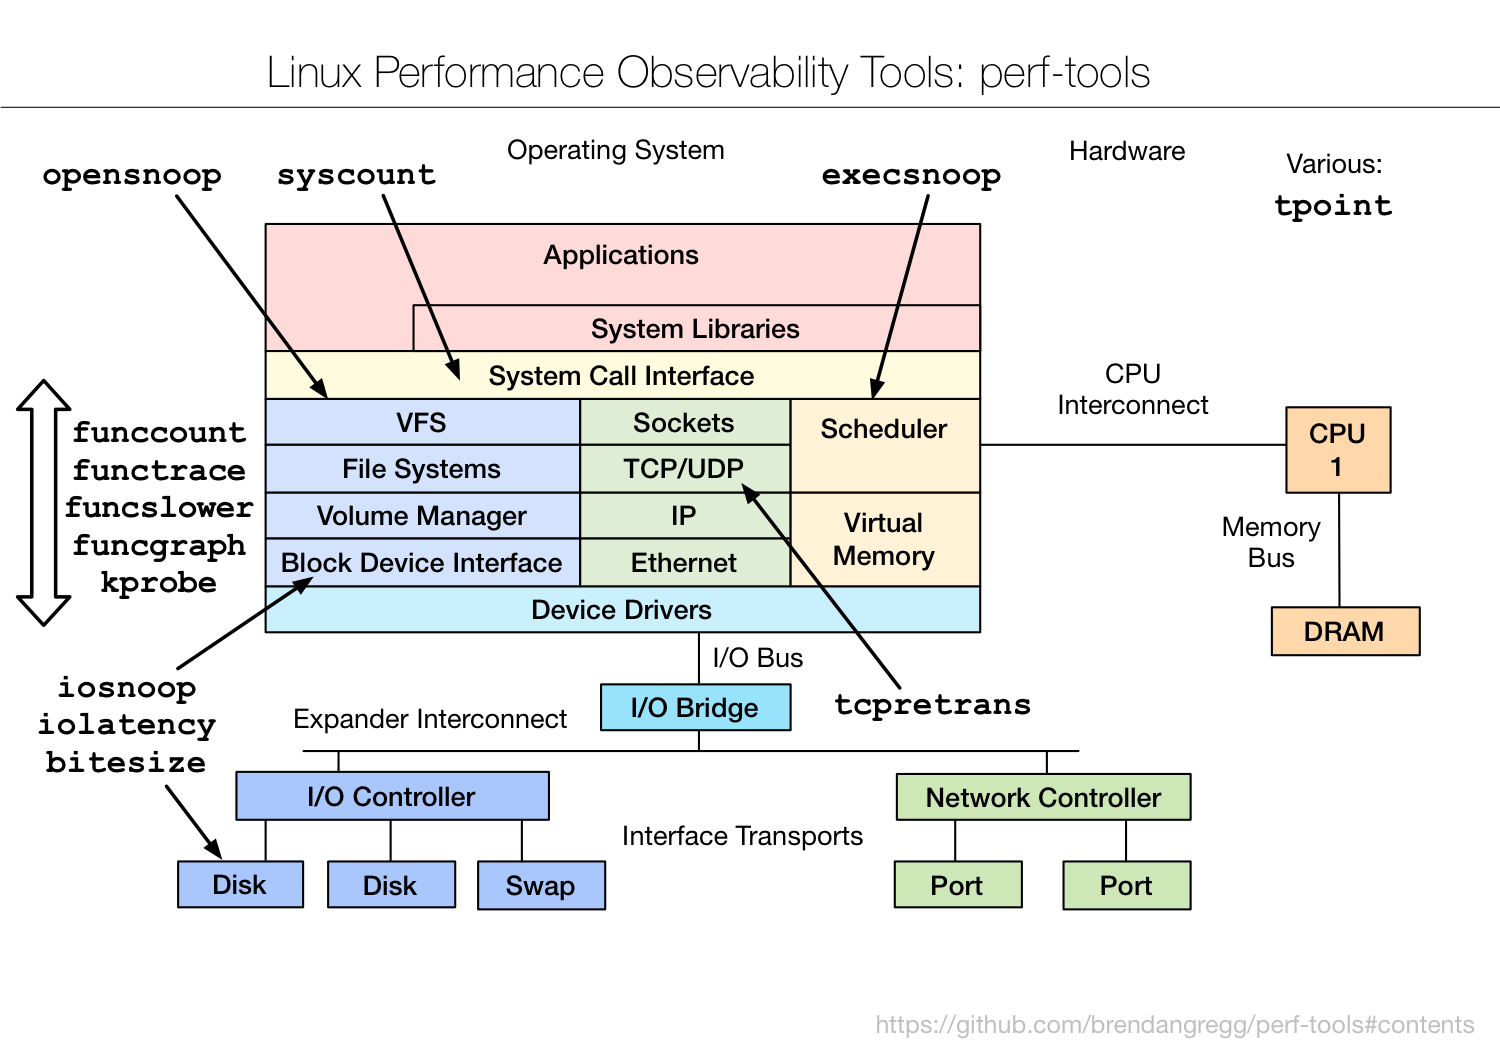
A miscellaneous collection of in-development and unsupported performance analysis tools for Linux ftrace and perf_events
(aka the “perf” command). Both ftrace and perf are core Linux tracing tools, included in the kernel source.
Using ftrace
iosnoop: trace disk I/O with details including latency
iolatency: summarize disk I/O latency as a histogram
execsnoop: trace process exec() with command line argument details
opensnoop: trace open() syscalls showing filenames
killsnoop: trace kill() signals showing process and signal details
fs/cachestat: basic cache hit/miss statistics for the Linux page cache
net/tcpretrans: show TCP retransmits, with address and other details
system/tpoint: trace a given tracepoint
kernel/funccount: count kernel function calls, matching a string with wildcards
kernel/functrace: trace kernel function calls, matching a string with wildcards
kernel/funcslower: trace kernel functions slower than a threshold
kernel/funcgraph: trace a graph of kernel function calls, showing children and times
kernel/kprobe: dynamically trace a kernel function call or its return, with variables
user/uprobe: dynamically trace a user-level function call or its return, with variables
tools/reset-ftrace: reset ftrace state if needed
Using perf_events
misc/perf-stat-hist: power-of aggregations for tracepoint variables
syscount: count syscalls by syscall or process
disk/bitesize: histogram summary of disk I/O size
Using eBPF
As a preview of things to come, see the bcc tracing Tools section. These use bcc, a front end for using eBPF. bcc+eBPF will allow some of these tools to be rewritten and improved, and additional tools to be created.